- Make use of the available command line commands
- Need a webserver
- Need a website to access the basement data and to control the actuators
The Webserver
I am not programmer who has done with webservers a lot and I have little knowledge about php, python, css and all these other knicks knacks available on the market. But I know perl, and I remember that perl was used (and is still used) for dynamic websites. To save time again, I decided that I want to use perl, because I do not want to learn yet another language, which is doing all the same anyway. And perl has system and open comamnds to call my C++ command line commands and it can also read out the return values easily. So I need a webserver, which can do perl (probably most webserver can do anyway).Next I had to decide which webserver I use. After a little research I found these:
I was reading pro and cons, and I got as many opinions about webservers as websites I have visited, such as: lighttpd has memory leaks, nginx performs so well, apache is overloaded, cherokee does not perform, fhem has too small community etc etc. I made my decision upon ease of use or ease of install on the raspberry pi. I found this website, and I was seeing that lighttpd is very easy to install (probably the others too, but first comes first) and it can do perl (probably the others too). Installation of lighttp was no problem at all.
The next decision was, what gateway I use to generate HTML code with perl. Again I made a little research, but much less than before. Pretty fast I decided to use standard CGI, just because I used it in the past once, because lighttpd supports it and because I found the book Web, Graphics & Perl/Tk from O'Reilly in my bookshelf where it is described (I have to admit I did not read much). I do not remember that I had to do something special in /etc/lighttpd/lighttpd.conf, I left the setup as is after installation. I would just recommend to everyone to take a look into this file to see if perl is enabled and to check the documents root. What is important though, is that you set the permission of the document root directly /var/www appropriately and that you set the group and owner to www-data (which is the owner's name of the webserver). I also created a directory cgi-bin in /var/www for the perl programs, see also this website.
Webpage Programming
Again I had to do some research because during my first trials, I created HTML content directly with perl print statements and the perl code did not really look good (perl code never looks good in my opinion). But I found some good perl tutorials here, which helped me to make a choice on using perl's HTML::Template. Here you can separate your perl program from your HTML code, and you dont have to use perl's print statements to generate HTML.The Login Page
First I did not want to spent too much time in all this, but I wanted a minimum in security. So a password entry is needed, before I can use my website. Considering that I do not have the raspberry pi running all the time, I think this is sufficient at the moment. I am not a security specialist, but I know I should not store the password in plain text for lookup on the server. I need to encrypt the typed in password and and I need to encrypt the lookup password and then compare both encrypted password. Another question was, where to store the encrypted password? I can use a file, but what if there are more than one user who want to have access. I thought that storing encrypted passwords in a simple file is not a good idea, so I chose mysql database to store them. The good part about perl is, that it has password encryption support Crypt::PasswdMD5 and mysql support DBI. So I installed the packages with the cpan command. I had to setup mysql first after installation. I basically did these commands on the raspberry pi:mysql -u root -p #starts my sql with root as user, and new command prompt mysql should show up
mysql> create database yourdatabase;
mysql> grant all privileges on yourdatabase.* to pi@localhost;
mysql> use yourdatabase
mysql> create table users(login varchar(20), password varchar(80));
mysql>exit
I found this program to generate a md5 encrypted password from plain text. Also I created a perl program to add a user into the database with the encrypted password as paramter (actually I pipe it). An extract of my perl program looks like this:
use DBI;
my dbname="yourdatabase"; #see above database creation
my username="pi"
my pw=....;
my data1 = "DBI:mysql:dbname";
my data2 = DBI->connect(data1, username, undef, { RaiseError => 1 }) || die( "cant open DB!");
my sql="insert users values('ARGV[0]', 'pw');";
my abfr1=data2->prepare(sql);
abfr1->execute;
I apologize for not showing the perl dollar signs. But blogger seems to have a problem with it.
Now I can add users with their encrypted passwords into the database. Back to the login page. Perl has another convenient library is CGI::Session. This is useful to pass on parameters from one page to another. Also it has the feature to expire, which gives another security element into my webpages. Below you find an extract of the perl code to generate the login page from the login HTML template. The template just consists of a form with user entry, password entry and a submit button, so I will not explain any further. If the user is entering the user name and password into the login webpage, then data is sent to the webserver and the login.pl program below is called again. This time it will call the function user_authenticated, which is just comparing the entered user name/password with the user name/password in the database. If they match, the webserver redirects to start.pl, which is the perl code to generate my website.
use CGI::Session;
use HTML::Template;
use Crypt::PasswdMD5;
use DBI;
my session = CGI::Session->new or die CGI::Session->errstr;
my template = HTML::Template->new(
filename => './login.tmpl',
associate => [session],
die_on_bad_params => 0,
global_vars => 1,
cache => 0 );
if ( cgi->param('Login') ) {
my home = './start.pl';
print cgi->redirect(home) if user_authenticated();
}
print session->header;
warningsToBrowser(1);
print template->output;
I apologize for not showing the perl dollar signs. But blogger seems to have a problem with it.
The login page looks like this:

The Curve Tab
The control system runs for two years with only few interruption. I was interested how the sensor data has developed during the past two years, so I think this could be best represented as a curve.Each time the control system gathers data from the sensors, it is stored in the 1-wire controller's eeprom. I implemented a couple of command line commands to query the sensor data from the 1-wire controller into the raspberry pi. The question was now, where to put the data. The answer came fast, since I started with a database while creating the login page. So it came natural to store the sensor data into the same database. So I created a new table with the followin mysql command:
mysql> use yourdatabase;
mysql> create table sensorvalues(id int not null primary key auto_increment, datestamp date, ... ,mot1 int);
Then I implemented a perl program which calls one of my command line commands to gather the sensor data from the 1-wire controller eeprom and stores them into the mysql database. Meanwhile the 1-wire controller has gathered more than 2500 entries, while each entry contains data and time stamps, two relative humidity values, two temperature humidity sensor values, two absolute humidity values, and five temperature sensor values. So I grouped the relative humidity data in one graph, the temperature humidity sensor values in one graph, the absolute humidity values in one graph and the five temperature sensor values in one graph. Therefore I will have four graphs with several curves on each. I have to admit that I did not read much in the book Web, Graphics & Perl/Tk from O'Reilly, but one interesting thing I have seen is, that graphs can be easily created with gnuglot. The installation for gnuplot is described here. The good thing about gnuplot is, that you can run it as a command line and it creates a picture file.
So what I need is a mysql command which retrieves all data within a time range (start date and end date) and stores it into a file, then a gnuplot command is executed with the file as parameter and with additional view settings. The perl commands to access the mysql database look like this:
my data2 = DBI->connect(data1, username, undef, { RaiseError => 1 }) || die("cant open DB!");
my @ergf;
startdate = ARGV[0];
enddate = ARGV[1];
sql = "select * from sensorvalues where datestamp between \"startdate\" and \"enddate\";";
my abfr1=data2->prepare(sql);
abfr1->execute;
I apologize for not showing the perl dollar signs. But blogger seems to have a problem with it.
Next the perl program stores all the data into a file called "data". Then it executes the gnuplot command line which looks like this for relative humidity picture:
open(GP, "| /usr/bin/gnuplot") or die "couldnt open gnuplot: !";
print GP "set terminal png size 1000,250\n";
print GP "set xdata time\n";
print GP "set timefmt \"%Y-%m-%d\"\n";
print GP "set xrange [\"startdate\":\"enddate\"]\n";
print GP "set yrange [0:100]\n";
print GP "set format x \"%Y-%m-%d\"\n";
print GP "set timefmt \"%Y-%m-%d %H:%M:%S\"\n";
print GP "set linestyle 2 lt 2\n";
print GP "set output \"relhum\_startdate\_enddate.png\"\n";
print GP "set xtics tics\n";
print GP "set style line 1 lt 2 lc rgb \"green\" lw 2\n";
print GP "set style line 2 lt 2 lc rgb \"red\" lw 2\n";
print GP "plot \"data\" using 1:3 ls 1 title 'relative humidity 0' with lines, \"data\" using 1:4 ls 2 title 'relative humidity 1' with lines\n";
close GP;
Note the line set xtics tics. I had trouble with the x-axis labels, which did overlap. By setting xtics to an appriopriate number, the overlapping problem disappeared. The code for the other graphs is similar, so I will skip this.
I added in the curve tab HTML template a HTML select forms, where I can setup the start date and the end date. As with the login page, I use HTML::Templates to split the perl program from the HTML code. I figured very fast that handling of dates are not easy. When calling the webpage I wanted that the browser shows the current date as the end date, and one week before that as a start date. That means I need to calculate seven days from todays date. In some cases it is easy to calculate, but in other cases not. Here gets perl convenient again, because there are libraries which are already doing this. I installed Date::Calc with cpan and I included the code below:
(sec,min,hour,mday,mon,year,wday,yday,isdst) = localtime(time - 7 * 86400);
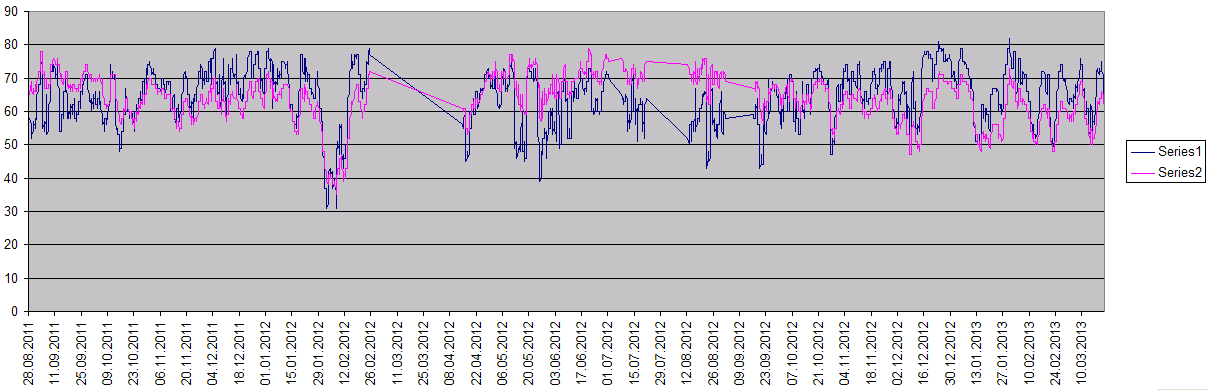
Below you see a picture of the curve tab webpage:

In the picture above you see the select forms to setup a start date and a end date, and submit button. The default setup is todays date as end date, and 7 days before that as start date. And you see two graphs with relative humidity and temperature humidity sensor curves.
The Sensor Tab
It is good to see the sensor values on curves, but it is not really easy to read out the exact value from them. So I came to the conclusion that I need another tab where I can see the exact values from a specific date and time.
I created an HTML select form so I can choose the date and the time from when I want to show the data. The time select form offers predefined time values, which are the times when the 1-wire controller stores the sensor values into its eeprom. After submiting with the button the webserver alls the sensor tab perl program, which is accessing the mysql database with the command:
sql = "select * from sensorvalues where timestamp like \"time0[0]:%\" and datestamp = \"sensorvalues{'sample_year'}-mon0-day0\";";
I apologize for not showing the perl dollar signs. But blogger seems to have a problem with it.
Then the perl program is storing the values into HTML::Template parameters and it is generating the HTML code from the template.
The Camera Tab
The camera tab shows the last feature I have implemented, but it is not finalized yet. When choosing the camera tab, the perl program generates HTML with a picture from a webcam, which I have installed in my backyard. I have described the implementation of the webcam in this forum (I used a raspberry pi for this too!).The problem which I was facing here is how to get the picture from my raspberry pi driving the webcam to my raspberry pi running the webserver. I decided to use scp in combination with secure/private keys. When things go automatically, I cannot use something where I need to type in a password manually. So I have to get around it. Fortunately it can be done without passwords, if I use the scp command with the -i option and with a private key generated by ssh-keygen. I stored the public key on the server side, which is in my case the raspberry pi driving the webcam. I created a perl script which is executing the following command:
my @args = ("ssh", "-i /somedir/privkey", "pi\@xxx.xxx.xxx.xxx ", "\"find /data/webcam/motion/* -type f -name \\*.jpg | sort -n | tail -1;\"");
open(IN, "@args |") or die "Can't open pipe: !";
I apologize for not showing the perl dollar signs. But blogger seems to have a problem with it.
The command above is first accessing the webcam raspberry via ssh. Then it executes the find command to create a list of jpg files (in this case the list has size one) the webcam has created. Then the perl program is executing the following:
my ret = system("scp -q -i /somedir/privkey pi\@xxx.xxx.xxx.xxx:line /var/www/cgi-b
in/pics");
I apologize for not showing the perl dollar signs. But blogger seems to have a problem with it.
It accesses with scp the raspberry pi driving the webcam and copies the jpg file directly into the cgi-bin. From there the HTML code can reference the picture.
A cron job is executing both commands above and it is starting them once an hour.This means that the picture is only updated once an hours as well.
Below you can see a picture of the camera tab.

Probably I will combine this in future with a HTML select form, where I can choose the picture I want to see.
Final Words.
I am pretty happy with the result of my project, though I cannot tell that it is finalized yet. The camera feature needs to be improved. I am still struggling about what to do to make it more usable. I thought about using swf files instead of jpg files, so I can see some movements.The webserver's performance is ok. It is definitively not fast, but it is sufficient for me. Especially the curve creation tab perl program takes some time (about 5-10 seccond), so I need to be patient there.
Another few words about perl. I used to dislike perl very much before I have done this project. The reason was that I cannot create good looking perl programs. But this completely has changed now after I realized how large the cpan library for perl is. I had the impression that for each problem I ran into, there was a perl library already available, such as Date::Calc, CGI::Session or Crypt::PasswdMD5. Meanwhile I really like perl!